Skip to content

7 articles

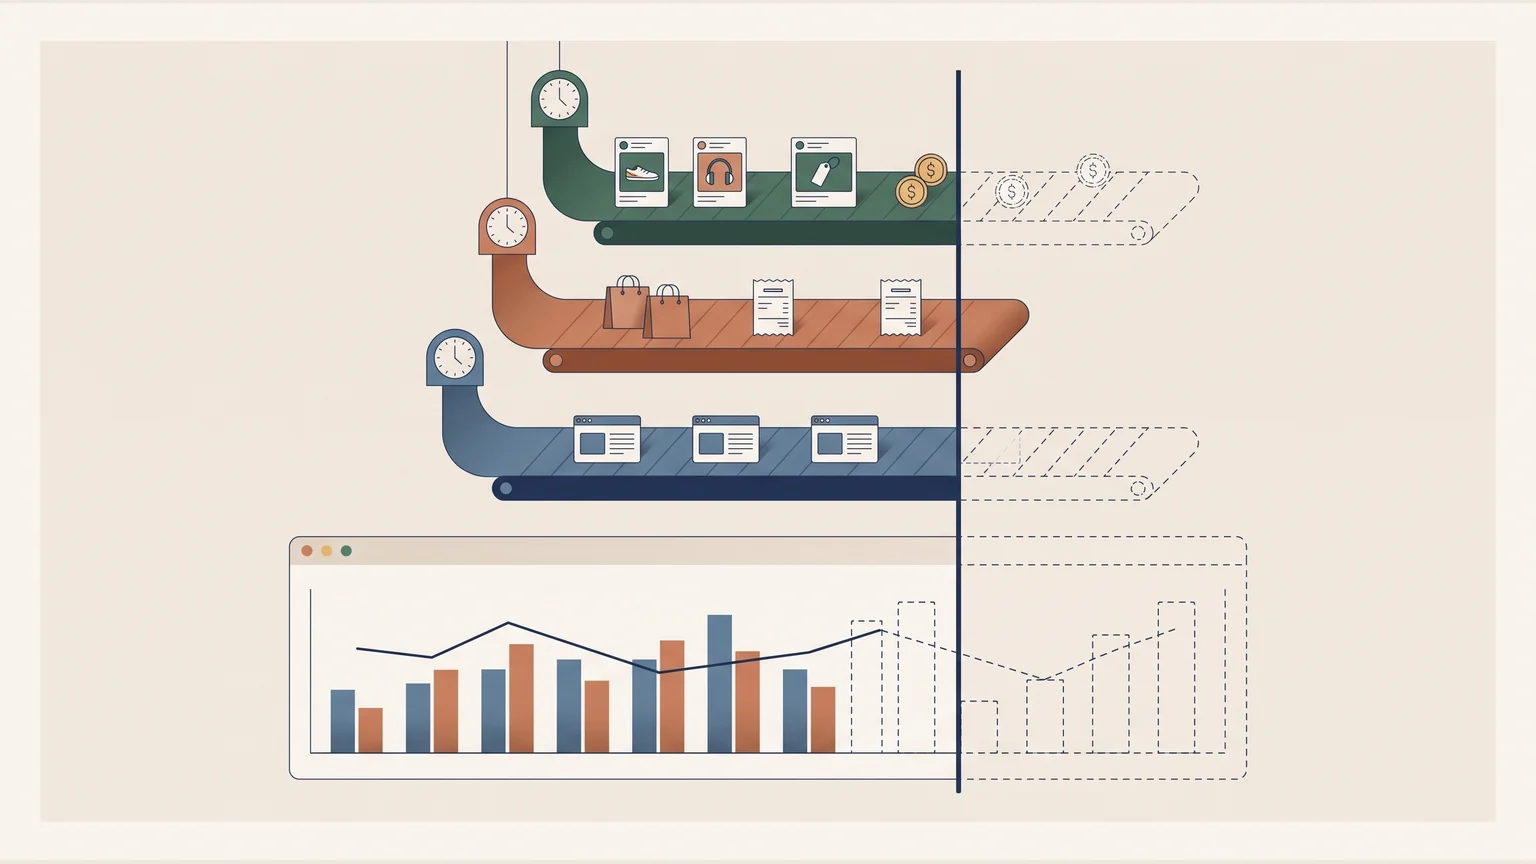
Three data ribbons (ads and spend, sales, web sessions) arrive with different clocks; one vertical line cuts all of them, and the chart, where the shortest ends.
Tools

Dashboard Data Freshness: Why Sources Need a Common Cutoff Time

A dashboard that compares sources refreshing at different times should show a common cutoff, the last hour all of them have complete. A fictional day, with ads complete through 3 p.m., sales through 1 p.m. and web traffic through 2 p.m., shows how a return metric otherwise mixes three clocks.


Several phones share one booking grid for two rooms, with a released interval and its change record.
Tools

Build a Room Booking App on Cloudflare Pages and D1

A small team can have a room-booking app built to its own measure with Cloudflare Pages, a D1 database and a coding agent. This one replaced a cowork's physical whiteboard for its two meeting rooms, where checking availability meant walking over to read it, and put that information on the phone.

A browser connects through a proxy to the origin server, with a secured HTTPS connection on each leg.
Tools

How to Point a Custom Domain to GitHub Pages with Cloudflare DNS

Pointing a custom domain at GitHub Pages through Cloudflare comes down to a few DNS records, a decision about www, and HTTPS with a real certificate. This walkthrough follows gonor.me from an empty DNS table to a working site, with the wrong turns left in.

A request travels from an analysis table to a remote source; the response returns through potential delay and failure points.
Tools

What Is an API? A Guide for Data Analysts (FRED, Banxico, World Bank)

An API is the interface that delivers data to your code, and analysts already use them when pulling Fed rates, Banxico exchange rates or World Bank life expectancy. Understanding it lets you diagnose failures, fix slow queries and build custom tools; the project shows this with real data and interactive labs.

A wide, shallow index tree highlights one route from the root to a leaf.
Tools

How B-Trees Work: Why Database Indexes Find One Row in 500 Million

A B-tree keeps data sorted in wide, shallow nodes, so a lookup among 500 million records can touch only about 9 nodes; PostgreSQL, MySQL and SQLite use it for their indexes. Understanding the structure changes how you design queries and judge the real cost of a lookup.

Two paths, prepared results and computation on request, converge into one analytical presentation.
Tools

Next.js and Recharts vs Power BI: Building Analytics Dashboards in Code

Next.js with Recharts is a serious alternative to Power BI and Tableau when a report must ship as a finished, fast, mobile-friendly product instead of a workspace artifact. Two dashboards, an Airbnb CDMX market analysis and an Olist e-commerce cohort study, test that claim.

A point on the circle projects onto a sine curve; a tangent shows its local change.
Tools

Euler's Formula, sin(x)/x Limit and Derivative of Sine: Interactive Visuals

Three interactive SVG visualizations let you manipulate the sin(x)/x limit, the derivative of sine and Euler's formula to see why each holds. They matter in actuarial and financial work: sin(θ) ≈ θ for small angles underpins the linear approximations used in sensitivities.