Skip to content

Blog

Essays, analysis, and technical notes on actuarial science, quantitative finance, data, and tools.

31 articles

Conceptual illustration: a product idea moves through a Codex workspace and becomes a video and a purchase page, with small plants suggesting growth.
Projects & analysis

From ad to purchase: how I built Motion Commerce Lab

Motion Commerce Lab turns marketing ideas into work people can open, review and change: six product ads and a proposed purchase page, built so the ad moment and the product-page moment are worked on together. This post tells how it was built.

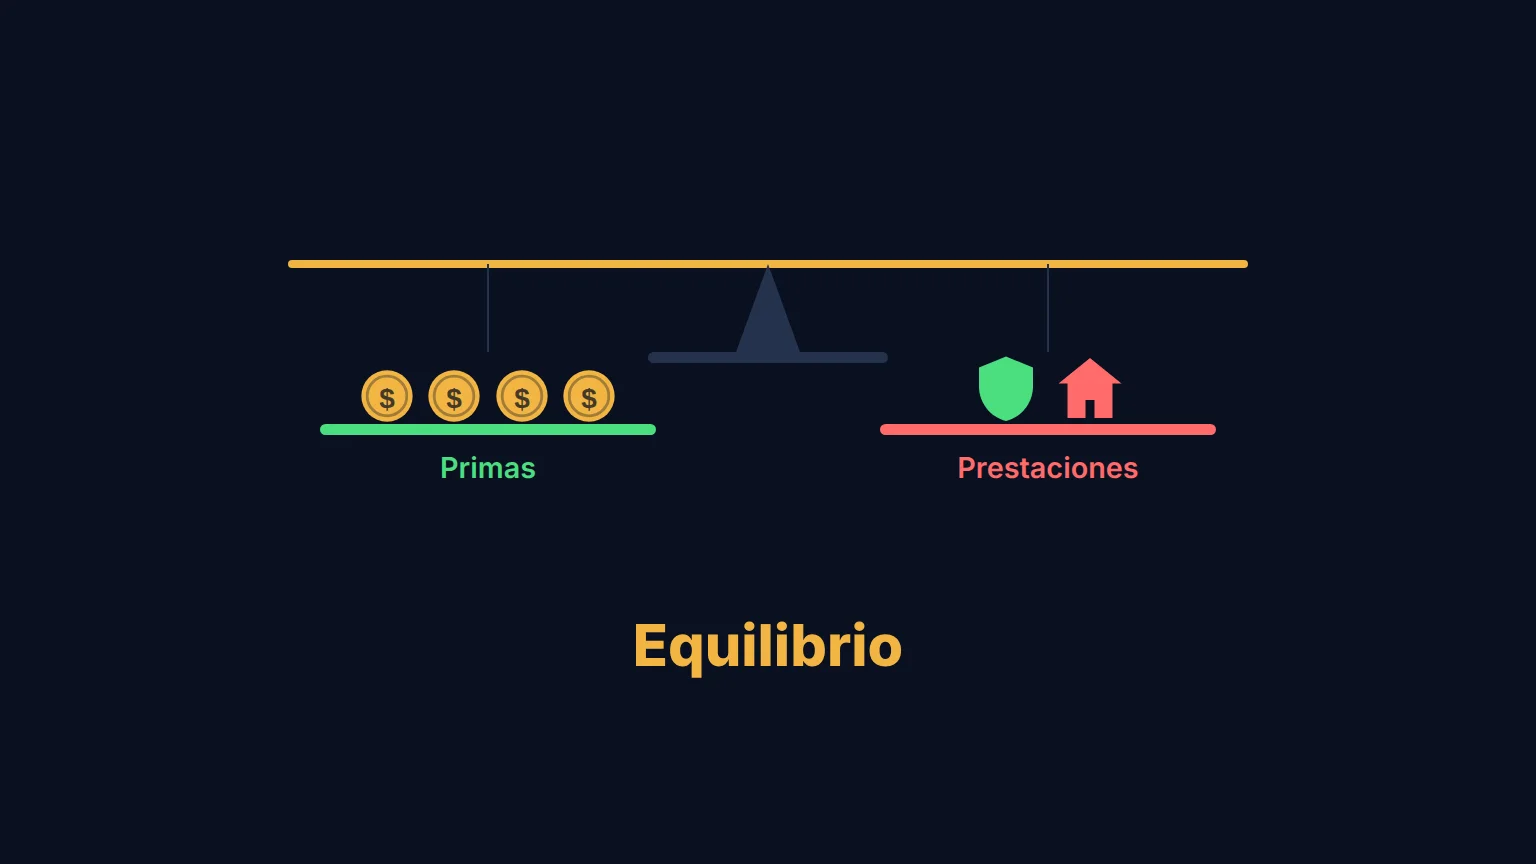
A scale with coins on the premiums side and a shield and a house on the benefits side, level under the word Equilibrio.
Actuarial for everyone

Equivalence Principle Explained: How Insurance Premiums Are Calculated

The equivalence principle sets the premium so that what the insurer expects to collect equals what it expects to pay in claims. This two-minute video (narrated in Spanish) explains it with images, and I made it with a coding agent: Remotion for the animation and an ElevenLabs synthetic voice.

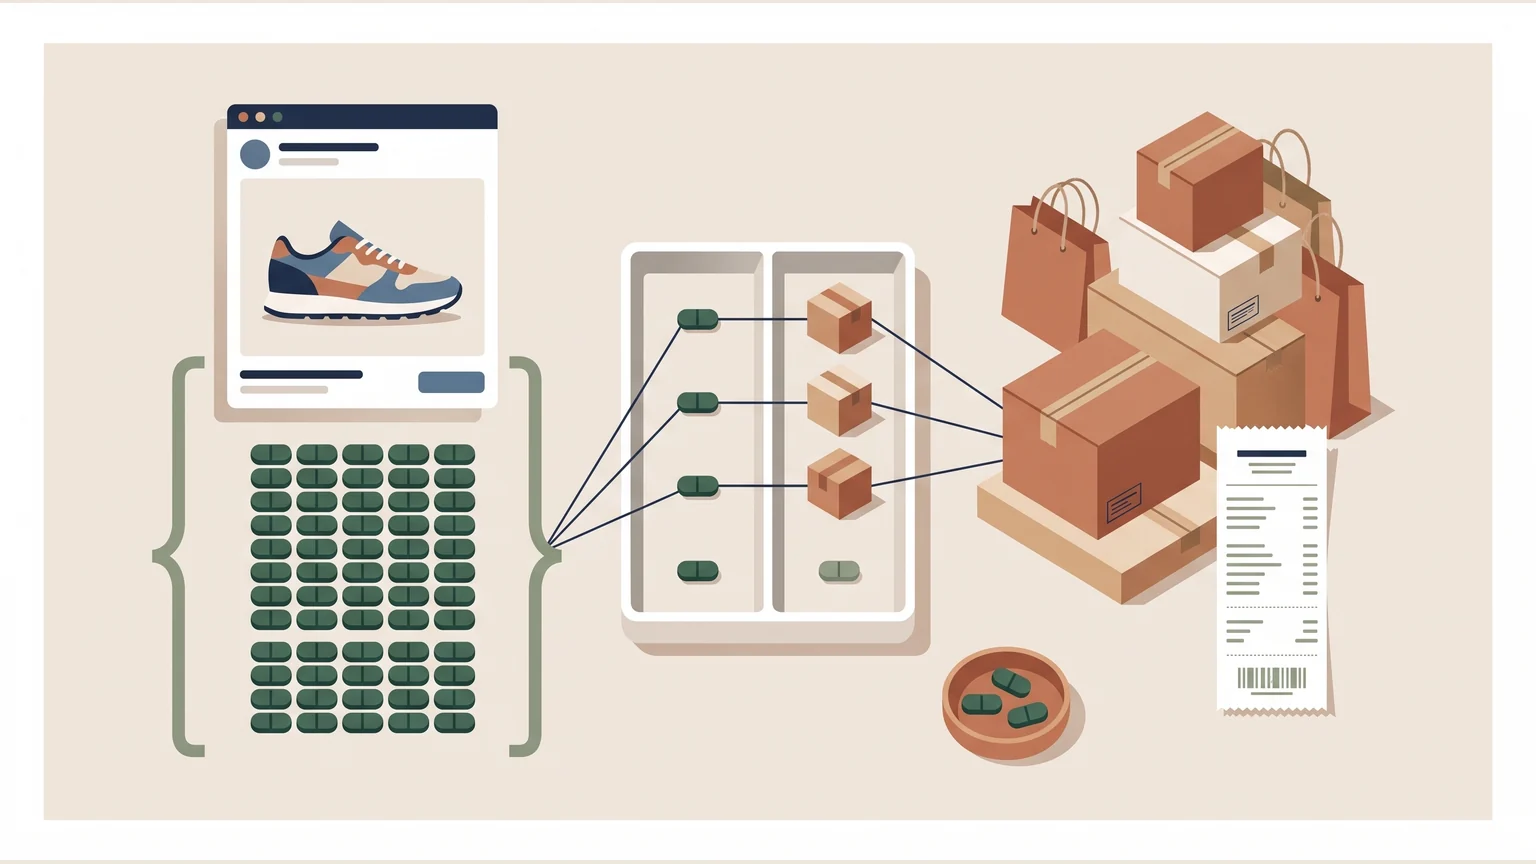
A column of conversions attributed to an ad is matched by threads to boxes of confirmed orders; a few conversions sit apart, with no order.
Projects & analysis

Why Ad Platform Conversions Don't Match Sales Data (and How to Reconcile)

Ad platform and sales counts differ because each observes a different moment, unit and attribution window, so neither is necessarily broken. A fictional example with 20 attributed conversions against 15 confirmed orders reconciles them and shows which number answers which question.

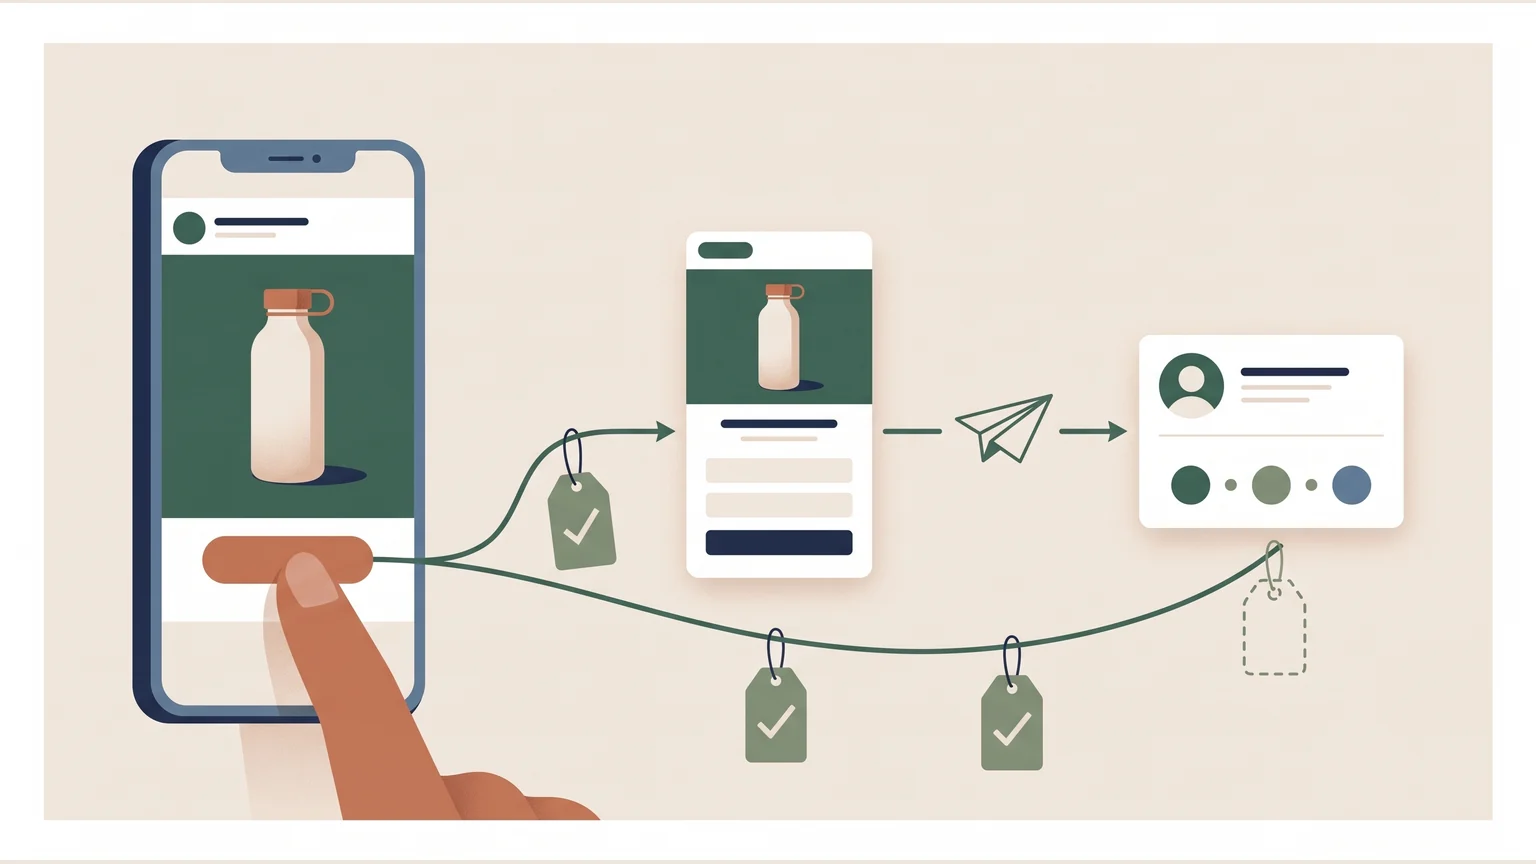
A product ad on a phone leads to a landing page with a form and to a CRM record; verified tracking tags hang along the path, except the last one, still empty.
Projects & analysis

How to Verify Ad-to-CRM Conversion Tracking Before Optimizing a Funnel

Verify each step of the journey, from ad click to page, form submission and CRM record, before reading a funnel decline as a user-experience problem. A fictional ad-to-CRM example shows which events, parameters and outcomes to check so an improvement decision rests on evidence.

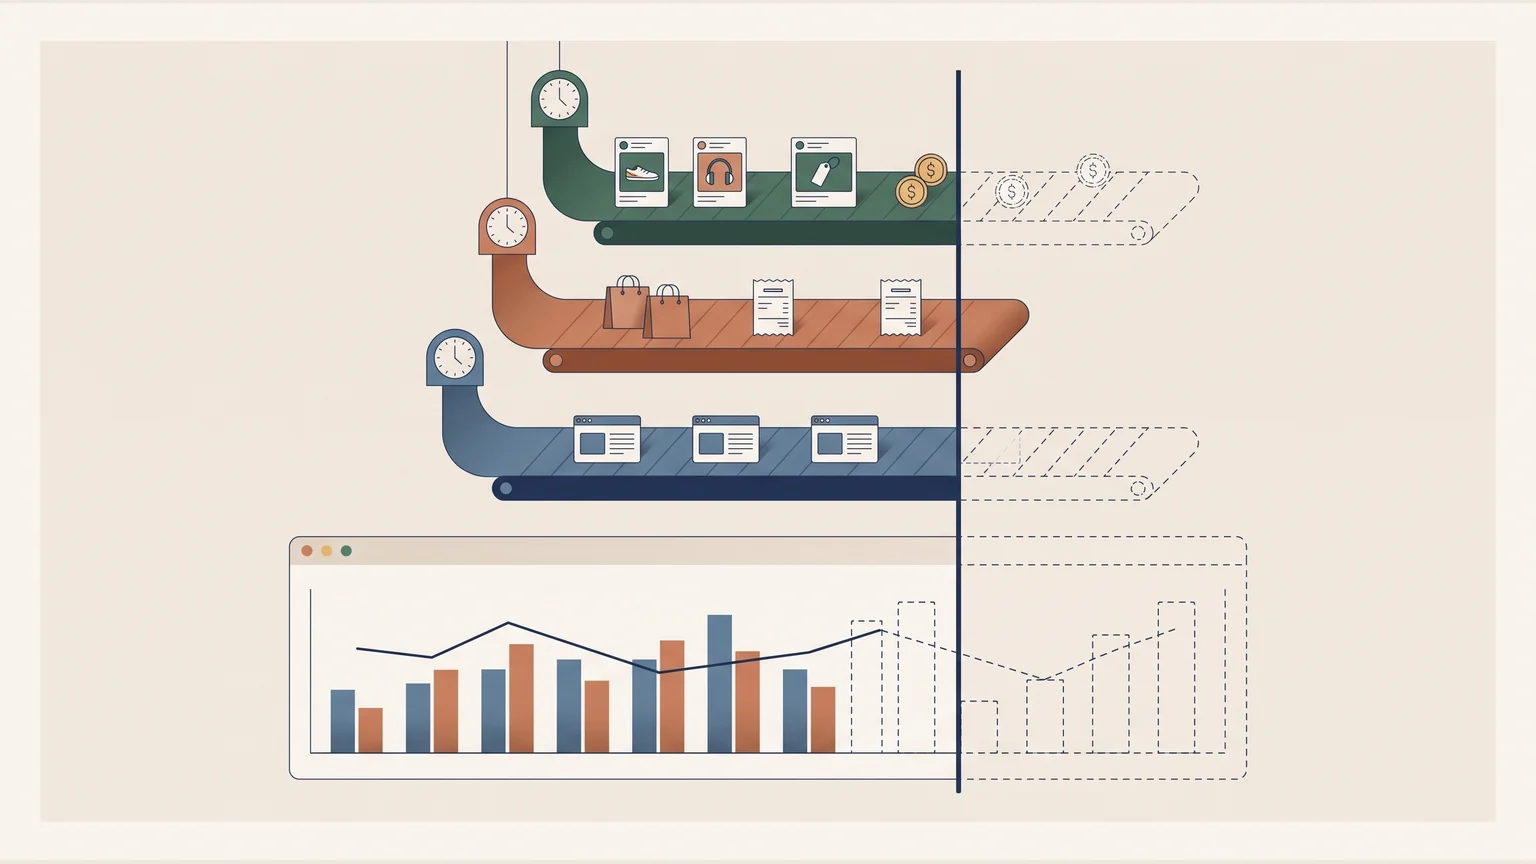
Three data ribbons (ads and spend, sales, web sessions) arrive with different clocks; one vertical line cuts all of them, and the chart, where the shortest ends.
Tools

Dashboard Data Freshness: Why Sources Need a Common Cutoff Time

A dashboard that compares sources refreshing at different times should show a common cutoff, the last hour all of them have complete. A fictional day, with ads complete through 3 p.m., sales through 1 p.m. and web traffic through 2 p.m., shows how a return metric otherwise mixes three clocks.

Controls build a car policy that feeds two instruments: an open formula with every weight visible and a box of trees whose lens shows what moved the prediction; behind them, the technical note.
Projects & analysis

Poisson GLM vs XGBoost for Insurance Pricing: Interactive Lab

On 678,013 motor policies XGBoost ranks risk better than a Poisson GLM, but a rate still has to be explained in a technical note and defended to a regulator, which keeps ML as a pricing challenger. The interactive lab shows SHAP explanations and a geographic fairness check.

Several phones share one booking grid for two rooms, with a released interval and its change record.
Tools

Build a Room Booking App on Cloudflare Pages and D1

A small team can have a room-booking app built to its own measure with Cloudflare Pages, a D1 database and a coding agent. This one replaced a cowork's physical whiteboard for its two meeting rooms, where checking availability meant walking over to read it, and put that information on the phone.

A browser connects through a proxy to the origin server, with a secured HTTPS connection on each leg.
Tools

How to Point a Custom Domain to GitHub Pages with Cloudflare DNS

Pointing a custom domain at GitHub Pages through Cloudflare comes down to a few DNS records, a decision about www, and HTTPS with a real certificate. This walkthrough follows gonor.me from an empty DNS table to a working site, with the wrong turns left in.

A request travels from an analysis table to a remote source; the response returns through potential delay and failure points.
Tools

What Is an API? A Guide for Data Analysts (FRED, Banxico, World Bank)

An API is the interface that delivers data to your code, and analysts already use them when pulling Fed rates, Banxico exchange rates or World Bank life expectancy. Understanding it lets you diagnose failures, fix slow queries and build custom tools; the project shows this with real data and interactive labs.

One shared owner connects three groups of borrowing companies in a relationship map.
Projects & analysis

CreditGraph: Graph-Based Credit Risk with Neo4j, PySpark and LightGBM on Guarantee Chains

Graph-based credit risk models loans as a network, so guarantee chains, circular guarantees and ownership concentration become measurable, which a relational loan table cannot express. A 500-client portfolio as a Neo4j knowledge graph, processed with PySpark on Databricks and scored with calibrated LightGBM, surfaces the structural risk that SQL keeps hidden.

Linked articles from two bodies of regulation are selected as evidence for a response connected to its sources.
Projects & analysis

RAG for Insurance Regulation: A LISF and CUSF Search Assistant

RAG suits insurance regulation because LISF and CUSF articles cross-reference each other, and Ctrl+F cannot tell the article that defines technical reserves from one that mentions them in passing. The agent indexes each article individually with a cross-reference graph, eliminating citation hallucinations so the model reasons only over the real text of the law and amplifies the actuary's memory without replacing their judgment.

Medical claims separate into three care categories, each with frequency and cost measures.
Projects & analysis

Mexico Major Medical (GMM) Pricing by Hospitalization Level (5.1M Claims)

Major medical expenses (GMM) can be priced by splitting 5.1M CNSF claims into three hospitalization levels instead of one average cost. 9,409 diagnoses are classified into those levels, with frequencies and severities by age and sex and an interactive tariff calculator. It began as a UNAM team project.

One set of auto claims feeds a premium decomposition, a reserve triangle, and anomaly review.
Projects & analysis

Auto Insurance Claims Dashboard: Pricing, Reserving and Fraud in Mexico

An auto insurer needs to answer three questions: how much to charge, how much to reserve and where the fraud is. This dashboard answers all three for the Mexican market, where roughly 70% of vehicles are uninsured: a frequency-severity GLM for pricing, IBNR reserves from two complementary methods and anomaly flags on claims before adjustment, on a synthetic portfolio calibrated with public CONDUSEF and AMIS data.

A modular actuarial calculation core connects the same logic to a library, a service interface, and a dashboard.
Projects & analysis

Open-Source Actuarial Library for Mexico: suite_actuarial (EMSSA-09, LISF)

suite_actuarial is an open-source Python library for Mexican actuarial work, covering eight domains (life, P&C, health, pensions, reserves, reinsurance, regulatory and configuration) with EMSSA-09 mortality tables, CNSF circulars and SAT tax articles built in. It installs with pip, deploys with Docker and exposes 28 REST endpoints alongside a bilingual Next.js dashboard; no other open-source library targets Mexican regulation.

Observed samples and modeled distributions meet on a comparison plate that keeps mismatches visible.
Projects & analysis

Quantitative Risk Analysis in Python: 13 Projects (VaR, Monte Carlo, Copulas, EVT)

Quantitative risk models become credible when implemented in typed Python with automated tests instead of left as formulas in a PDF. Thirteen modules cover portfolio VaR, Monte Carlo simulation, copulas, EVT, deep hedging and graph neural networks for systemic contagion, each pairing LaTeX theory with reproducible results on public market data.

Claim records pass through validation and structured tables; an exception branches to review before analysis.
Projects & analysis

Insurance Claims Data Pipeline on GCP: BigQuery, Dataform, Terraform

An insurance claims data platform on GCP chains streaming intake, a BigQuery warehouse, Dataform transformations, Terraform provisioning and Tweedie GLM pricing in six connected projects. It frees actuarial teams from spreadsheets and manual processes with an automated, tested and reproducible flow that turns raw claims into regulator-ready inputs.

An index-guided access selects one record, while a column-oriented read gathers data for an aggregation.
Projects & analysis

PostgreSQL vs BigQuery: When to Use Each (5.74M-Flight Benchmark)

Use PostgreSQL for indexed point lookups (2.6ms against about 500ms minimum on BigQuery) and BigQuery for full-table analytics at low cost. Both are measured on 5.74M real flight records, from PostgreSQL index optimization through the migration to BigQuery, with real timings, costs and query plans.

Two routes convert a work history into pension payments; the individual-savings route includes a conditional supplement.
Projects & analysis

IMSS Pension Simulator: Ley 73, Ley 97, and Fondo Bienestar in One Tool

The IMSS Pension Simulator compares what a worker would receive under Ley 73, Ley 97 (AFORE) and Fondo Bienestar, implementing all three formulas with current data (UMA, CONSAR tables, EMSSA 2009 mortality). Most Mexican workers do not know their regime or expected pension; interactive sensitivity analysis gives an educational estimate that shows what they control and what they do not.

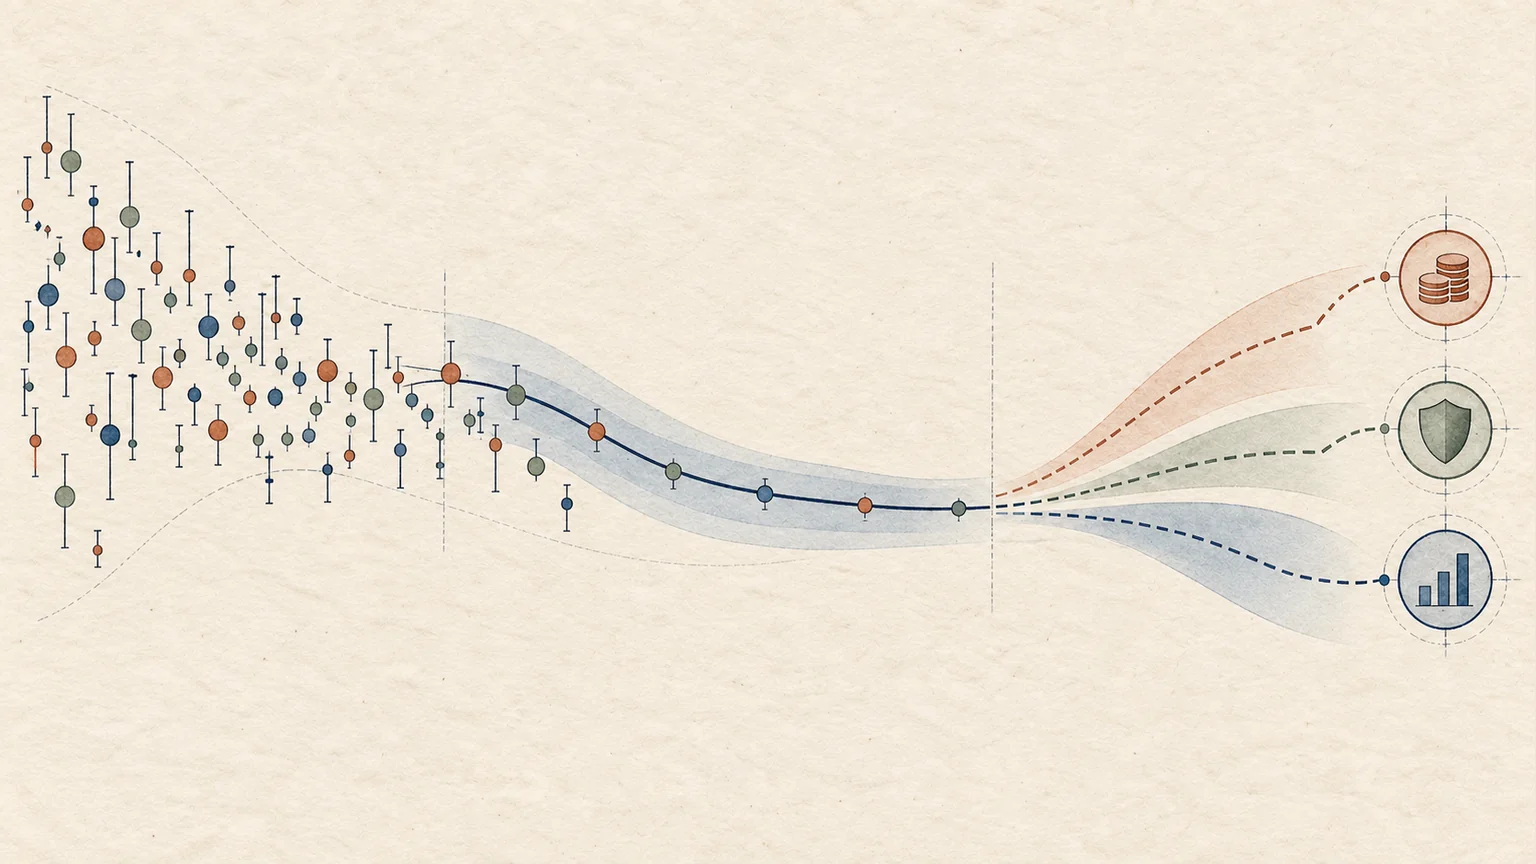
Mortality observations become a graduated curve, a projection with uncertainty, and actuarial calculation blocks.
Projects & analysis

Mortality Tables to Solvency Capital: Life Insurance Pricing under LISF

Life insurance pricing starts by graduating raw mortality data: SIMA takes INEGI and CONAPO deaths and population, smooths them with Whittaker-Henderson and Lee-Carter, and projects forward to premiums, reserves and capital requirements under the LISF. Everything is exposed as an API to connect with other systems, automate sensitivity analysis and meet CNSF requirements; it is open source and built to expand into other lines of business.

Motor policies take two paths: a row of multiplicative factors and a grove of decision trees; both end at nearly identical price tags.
Projects & analysis

ML Insurance Pricing: Poisson GLM vs XGBoost vs LightGBM (freMTPL2)

Insurance pricing with ML splits the problem into claim frequency and severity, then compares a Poisson GLM against XGBoost and LightGBM on 678,013 policies from freMTPL2. SHAP explainability and a fairness audit check each model, and a cross-border analysis asks what these European pricing techniques mean for Mexico, where roughly 70% of vehicles carry no coverage.

A wide, shallow index tree highlights one route from the root to a leaf.
Tools

How B-Trees Work: Why Database Indexes Find One Row in 500 Million

A B-tree keeps data sorted in wide, shallow nodes, so a lookup among 500 million records can touch only about 9 nodes; PostgreSQL, MySQL and SQLite use it for their indexes. Understanding the structure changes how you design queries and judge the real cost of a lookup.

Different data series follow a common process of organization, segmentation, and comparison.
Projects & analysis

Data Analyst Portfolio: 7 End-to-End Projects

Seven end-to-end projects across six domains: real estate, insurance reserves, e-commerce cohorts, product experimentation, finance (SaaS KPIs and portfolio risk), and public-sector operations. The same statistical toolkit runs through all of them, and that is the argument: a data analyst has to hold several domains in view at once, because range is what makes depth transferable. Each project ships as an interactive dashboard, all on one live domain.

Two paths, prepared results and computation on request, converge into one analytical presentation.
Tools

Next.js and Recharts vs Power BI: Building Analytics Dashboards in Code

Next.js with Recharts is a serious alternative to Power BI and Tableau when a report must ship as a finished, fast, mobile-friendly product instead of a workspace artifact. Two dashboards, an Airbnb CDMX market analysis and an Olist e-commerce cohort study, test that claim.

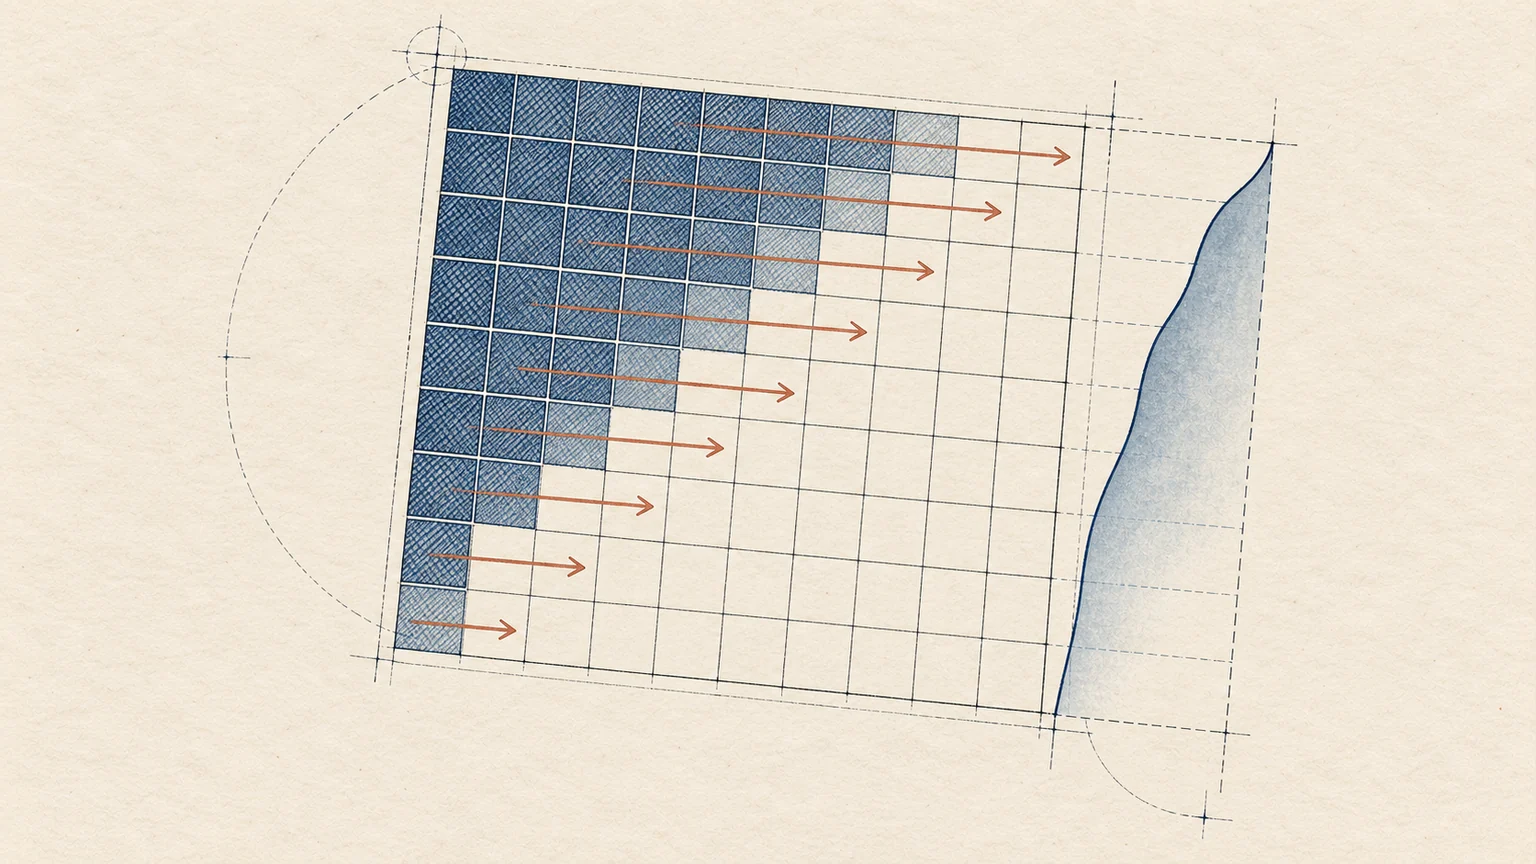
A development triangle distinguishes observed payments from estimated future-development cells.
Projects & analysis

Loss Reserving with Chain-Ladder and Bornhuetter-Ferguson (NAIC Data)

Insurance reserves are estimated by developing loss triangles with methods such as Chain-Ladder and Bornhuetter-Ferguson, which produce IBNR estimates. An interactive dashboard on NAIC Schedule P regulatory data applies both actuarial methods across six lines of business, with loss triangles, IBNR and combined ratios, to answer whether reserves are enough.

The same ordered dots appear on two scales; the transformation compresses values while preserving the group below the percentile.
Actuarial Fundamentals

How to Find Percentiles of a Transformed Random Variable (SOA Exam P)

To find a percentile of a transformed random variable, such as an insurer's payment after a deductible, invert the transformation and use the CDF you already have instead of deriving a new distribution. The post builds this from the ordinary deductible, the way SOA Exam P tends to ask it.

A small policy pool is compared with a larger one; the average-loss distribution is narrower for the larger pool.
Actuarial Fundamentals

Central Limit Theorem in Insurance: Why Pooling Risk Works (SOA Exam P)

The Central Limit Theorem (CLT) is the mathematical justification for why insurance works as a business: aggregating many risks makes the total behave predictably. This SOA Exam P study guide also covers multivariate random variables, covariance and dependence, and Eve's Law for decomposing variability.

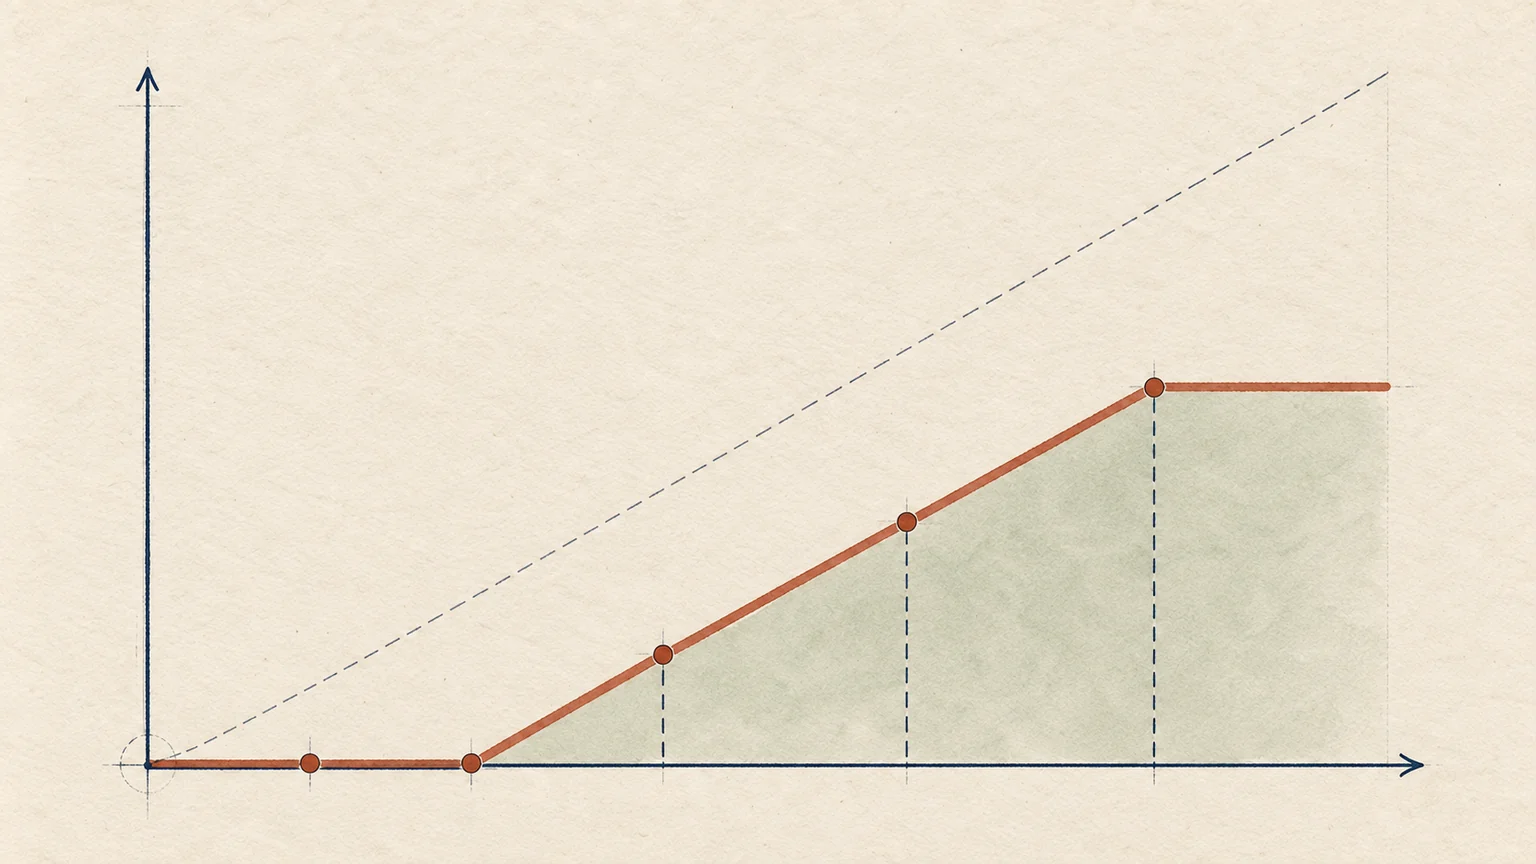
The payment curve stays at zero, rises after the deductible, and flattens at the coverage limit.
Actuarial Fundamentals

SOA Exam P Random Variables: Deductibles, Policy Limits and Payment Math

The univariate random variables section, about 45% of SOA Exam P, tests distributions, expected values and payment modifications such as deductibles and limits, and mechanical errors cost more than conceptual ones. This study guide shows how the pieces connect and why they matter in insurance.

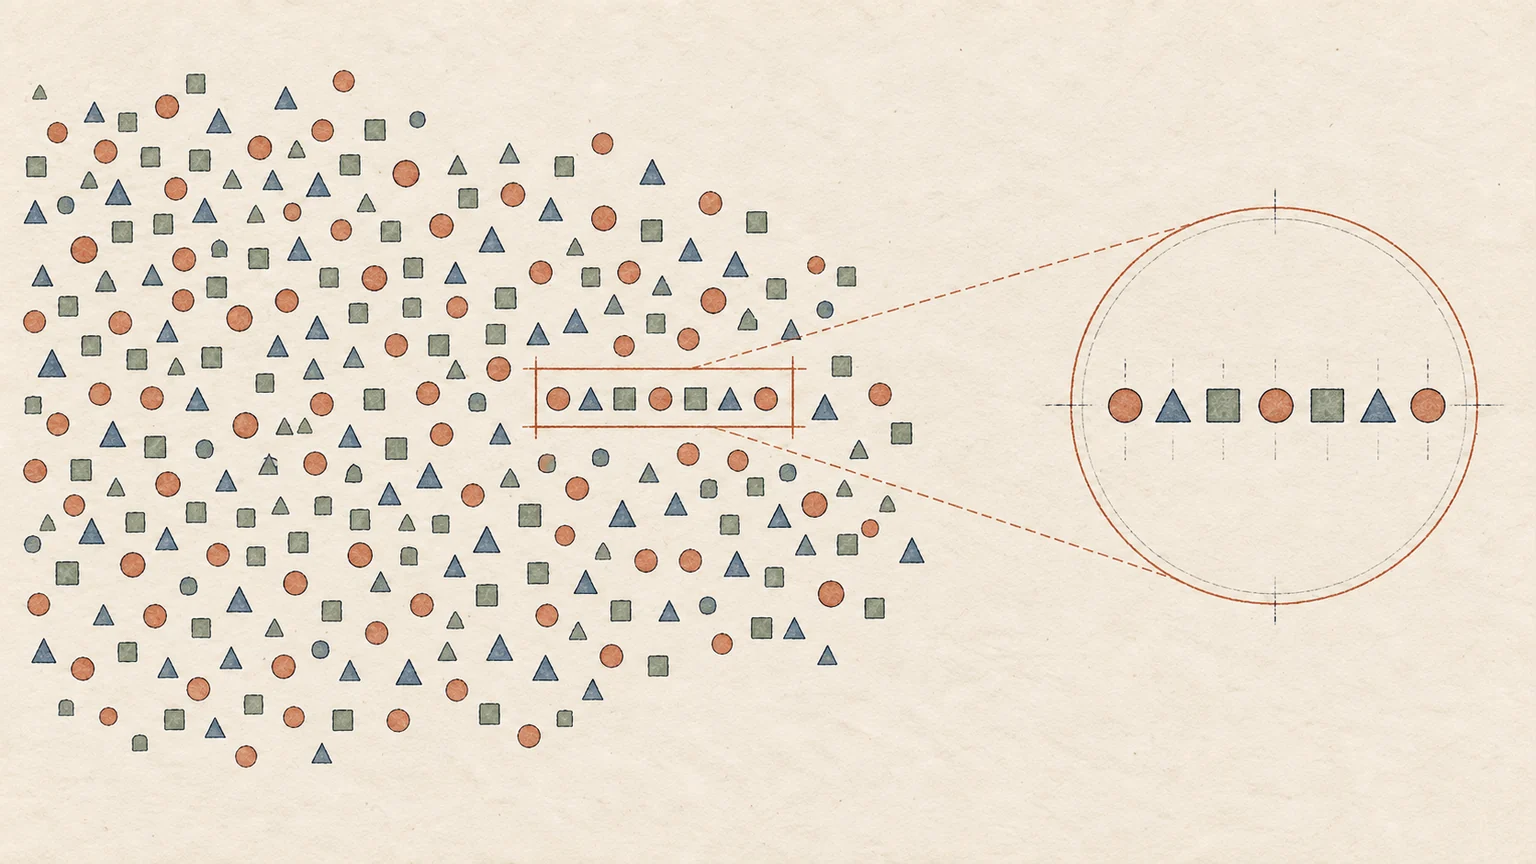
A highlighted subset of cases is enlarged; its colors stay the same while the reference population changes.
Actuarial Fundamentals

SOA Exam P Probability Study Guide: Axioms, Conditional Probability, Bayes

The first section of Exam P covers probability axioms, conditional probability and Bayes, the toolkit an actuary uses to classify risk and decide under uncertainty. This study guide explains why the SOA puts them first and how they connect to real actuarial work.

A sequence of tiles passes through a causal attention matrix and produces probabilities for the next tile.
Projects & analysis

Build a Transformer from Scratch in NumPy: Trained on Proust's 7 Volumes

A transformer built from the first matrix multiplication in pure NumPy, with no autograd, shows what happens inside a language model. Trained on all 7 volumes of Proust, it taught me less about the architecture than about what it means that everything is just numbers.

A point on the circle projects onto a sine curve; a tangent shows its local change.
Tools

Euler's Formula, sin(x)/x Limit and Derivative of Sine: Interactive Visuals

Three interactive SVG visualizations let you manipulate the sin(x)/x limit, the derivative of sine and Euler's formula to see why each holds. They matter in actuarial and financial work: sin(θ) ≈ θ for small angles underpins the linear approximations used in sensitivities.